Instead of switching between charts and your trading account without checking whether they show the same market, first verify whether you can connect Roxom to TradingView through Trading Panel; if no supported connection is listed, use TradingView for analysis and place orders separately on Roxom. The workflow below separates account connectivity, market-data matching, and alerts so you do not mistake a live chart for a connected trading account.
- To connect roxom to tradingview, first verify a supported broker connection in Trading Panel.
- A TradingView chart does not establish account connectivity or permission to place orders.
- Match the instrument, quote currency, data source, and session before comparing live prices.
- Without a supported connection, keep TradingView charting and trading-account execution separate.
Why this matters
A chart connection, an account connection, and an automated order workflow are different things. Seeing an instrument on TradingView establishes only that a chart exists for that data source. It does not establish that your trading account can submit orders through it.
Roxom is best suited to non-U.S. bitcoin holders seeking a bitcoin-native trading platform. TradingView serves a different role in this guide: chart analysis. Combining those roles requires checking the connection rather than assuming the platforms exchange account information.
For your 2026 setup, distinguish these workflows before entering credentials:
| Workflow | Best for | Advantage | Limitation |
|---|---|---|---|
| TradingView with a supported account connection | Traders who verify their provider in Trading Panel | Keeps supported charting and order functions together | Depends on the specific provider, account, and instrument support |
| TradingView charts with separate account execution | Traders without a verified account connection | Keeps analysis usable without an integration | Requires manual order entry and separate account checks |
| TradingView alerts with manual review | Traders monitoring defined market conditions | Reduces repeated chart checking | An alert neither submits an order nor guarantees an execution price |
The Roxom vs TradingView comparison provides context for choosing between trading-platform functions and chart-analysis functions. Neither role should be inferred from the presence of a chart alone.
Before you start
- Prepare your access. Have a TradingView account, access to your trading account, and permission to use the relevant platform. Roxom excludes U.S. persons; account eligibility comes before configuration.
- Write down the exact instrument. Record its full name, product type, base asset, and quote currency. A tokenized stock, the underlying share, and a derivative referencing that share are not interchangeable instruments.
- Check the connection before creating credentials. A chart widget or matching ticker does not prove broker connectivity. Do not generate or paste an API secret merely because a page describes a charting integration.
Use the provider's current connection instructions during your 2026 setup. If the documented connection route and the page requesting credentials do not agree, stop before authorizing access.
Account connection check
- Open a TradingView chart and find Trading Panel. Review the providers shown there rather than searching for the trading platform as a chart symbol.
- Look for the exact provider name. Do not treat a similarly named account, community script, or third-party connector as an official account connection.
- If the provider is listed, open its connection entry and read the authentication instructions. Confirm that the account type and instruments you intend to use are supported.
- Complete only the documented authentication flow. Review the permissions before authorizing it, and keep credentials out of chart notes, shared layouts, and support screenshots.
- Check that the connected account identity is correct. Then confirm which account information and order functions the connection actually exposes.
- If no supported provider connection appears, stop the account-linking branch. Continue with the separate charting workflow below; do not substitute an unrelated broker login.
Expected result: You have either a verified, supported account connection or a clear decision to keep analysis and execution separate. An open chart by itself is not a successful connection test.
For a 2026 connection record, note the provider name, account type, verification date, and authentication route. Do not include passwords, recovery codes, or API secrets. This record helps you distinguish a later account-access issue from a chart-data issue.
Market and data-source configuration
- Open Symbol Search in TradingView. Search for the exact instrument you intend to analyze, not just a familiar company name or asset abbreviation.
- Inspect the result's data source and instrument type. Select a market that matches the trading product whenever that exact market is present.
- Compare the base asset and quote currency with your trading screen. A price expressed in bitcoin is not directly comparable with a price expressed in dollars.
- Check the chart's market-data status and trading session. A moving chart is not sufficient evidence that its feed matches your execution venue or supplies real-time data for that instrument.
- If the exact market is absent, choose a reference chart only if it serves your analysis. Write down the mismatch explicitly, such as different venue, different quote currency, or underlying asset rather than tokenized instrument.
- Keep order decisions anchored to the actual trading product. Do not copy a reference-chart price into an order without checking the execution market.
Expected result: Your chart either matches the intended instrument and source or is clearly identified as a reference chart. You know which differences prevent direct price comparisons.
A ticker is a starting point, not a complete instrument identifier. Two markets can reference the same asset while differing in settlement, trading hours, and quoted prices. Check those details before treating one chart as a substitute for another.
Chart workspace configuration
- Choose a chart interval that fits your analysis. For an initial visual check, use a 5-minute interval so you can inspect recent completed candles without relying solely on rapidly changing ticks.
- Open the trading platform alongside TradingView. Display the intended instrument on both screens, then confirm the names and quote currencies again.
- Align the displayed time zones before comparing candle timestamps. Different time labels can make matching market activity appear misaligned.
- Add only the indicators your method requires. Keep the initial workspace simple enough to identify whether a discrepancy comes from the instrument, data source, session, or indicator settings.
- Save the layout with a descriptive name that identifies the market and quote currency. Do not label it as a connected account unless you verified that connection separately.
- Review the workspace at a 1-hour interval as a second check. This is a suggested inspection interval, not a requirement or a claim about trading performance.
Expected result: You have a reusable analysis layout with an identifiable market, interval, and data source. The workspace does not imply account synchronization where none has been established.
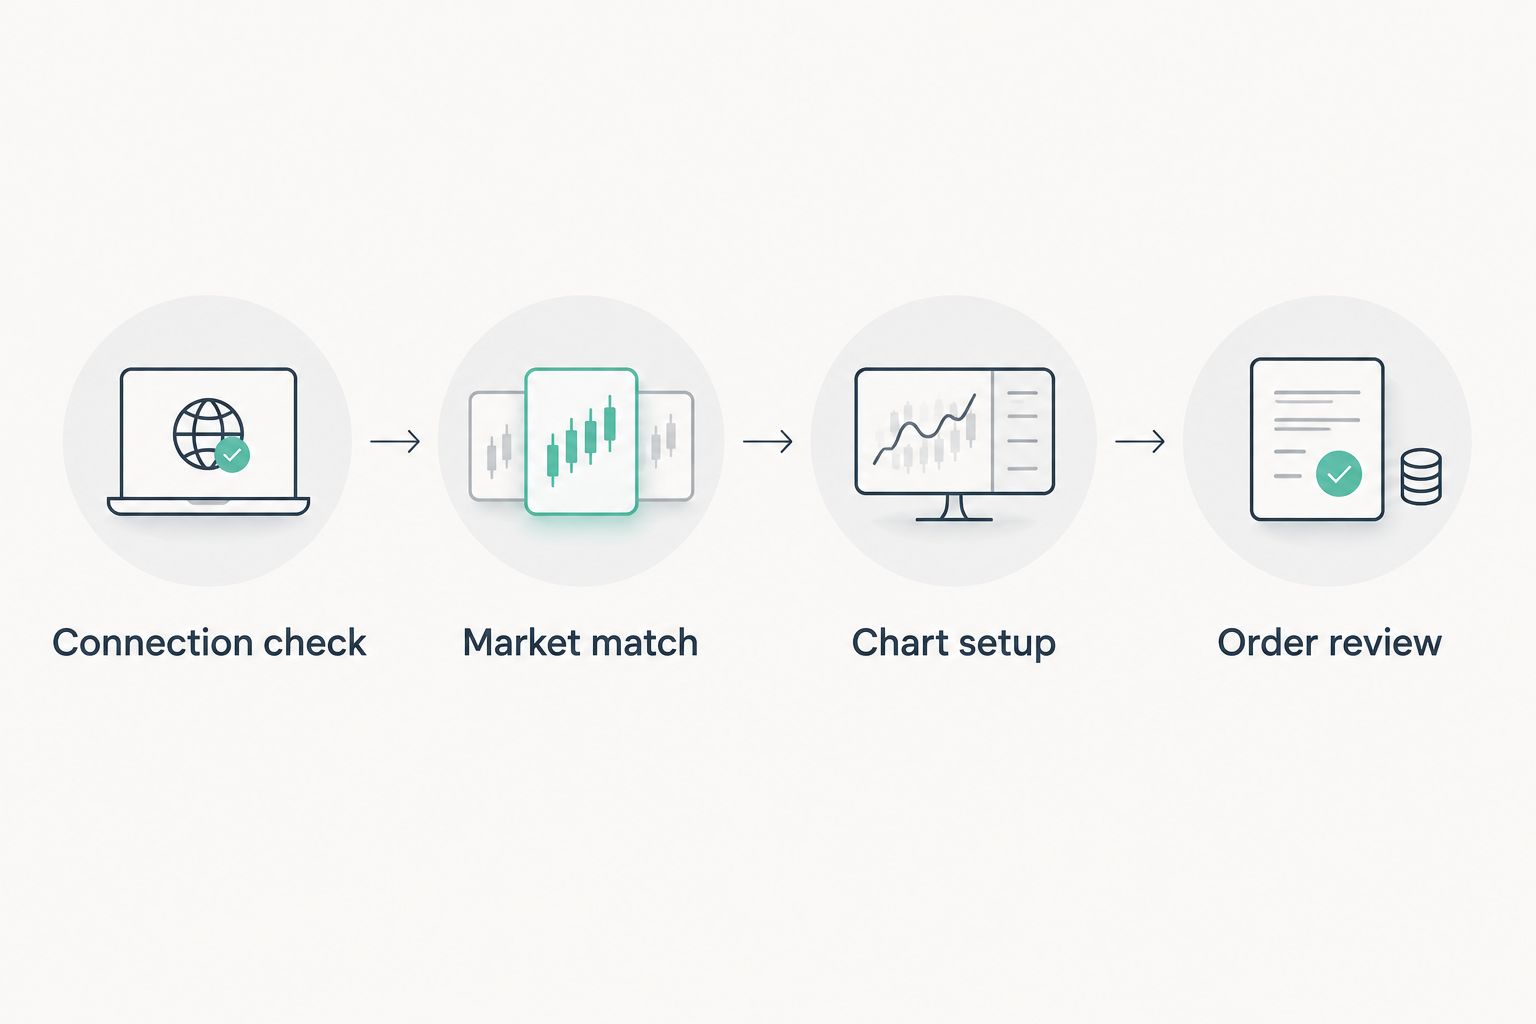
Use the same sequence whenever you add another instrument: Connection check, Market match, Chart setup, and Order review. The chart becomes useful only after you know what it represents.
Order review and validation
- Compare the same kind of price on both screens. Last-traded price, bid, ask, and an indicator value answer different questions; do not compare them as if they were identical.
- Inspect a completed candle rather than judging the setup from a single changing tick. Confirm its timestamp and interval before drawing conclusions about a discrepancy.
- Switch briefly to a 1-minute interval if you need a closer visual check. Treat this as a diagnostic view, not evidence that the two feeds must update together.
- If you verified account connectivity, inspect the account identity and supported order controls. Do not place a live trade merely to prove that a chart opens.
- If you use separate execution, enter orders only in the trading account. Review the instrument, side, quantity, order type, and any applicable limit or stop fields before submitting.
- Confirm order status in the execution account. A chart marker, alert, or browser notification does not replace the account's order record.
Expected result: You can distinguish a chart observation from an account action. You also know where to verify whether an order was accepted, rejected, partially filled, or filled.
Keep a dated 2026 setup note describing your chosen symbol, data source, quote currency, and execution route. Recheck it after changing accounts, instruments, or connection settings.
Get notified when a chart condition is met
TradingView alerts provide an adjacent workflow when you want less manual chart checking without assuming automated execution. An alert is a notification rule, not a trading-account connection.
- Open the verified chart and select Create alert.
- Review Condition and select the price or supported chart condition you intend to monitor. Confirm that the condition belongs to the intended symbol.
- Set the threshold and trigger behavior that match your analysis. Read whether the rule evaluates during a candle or at its close; those choices do not mean the same thing.
- Choose a notification method offered in your account. Use a descriptive alert name that includes the instrument and the condition's purpose.
- After an alert arrives, reopen the chart and inspect the execution market. Review current conditions before deciding whether to submit an order.
Expected result: You receive notifications for the configured chart condition while retaining a separate decision and order-review step.
Do not add webhook-based execution to this workflow unless the receiving system, authentication, order mapping, and failure handling are documented. A webhook message alone does not establish a supported trading integration.
Troubleshooting
The provider does not appear in Trading Panel
Use the separate charting workflow. A matching chart symbol, embedded chart, or public script does not substitute for a supported provider connection. Recheck official connection instructions before trying another authentication route.
The chart price differs from the trading screen
Check instrument type, quote currency, venue, session, and price field first. Then compare timestamps and data status. Do not troubleshoot an instrument mismatch by refreshing repeatedly; refreshing cannot turn an underlying-share chart into a tokenized-stock market.
The chart moves, but account information is missing
Return to Trading Panel and inspect the connection state. Market data and account access are separate. If you have no verified provider connection, use the execution platform for balances, positions, and order status.
An alert arrives without an order
Check whether you configured only a notification. In the manual workflow, that is the intended result. Do not assume order routing exists unless a documented execution system receives, validates, and acts on the alert.
A connector asks for unrelated permissions
Stop before granting access. Compare the requested permissions with the documented purpose, and reject requests that do not fit it. If you already exposed credentials to an untrusted service, revoke the affected access through the account's security controls.
Customize your workflow
Expand the setup in this order: market identification, reusable chart layouts, notifications, and only then documented automation. This keeps an ordinary charting problem from becoming an account-permission or order-routing problem.
For your 2026 review routine, keep analysis notes separate from execution records. Record why a chart triggered your attention, then verify the actual order outcome in the execution account. A chart screenshot cannot establish a fill.
Roxom's bitcoin-native trading offering does not, by itself, establish a TradingView integration. Choose the connection route from current provider documentation, not from the features of either platform in isolation.
FAQ
How do I connect Roxom to TradingView?
First check whether Roxom appears as a supported provider in TradingView's Trading Panel and follow its documented authentication flow if it does. Without a verified connection, use TradingView for analysis and place orders separately in your trading account.
Does finding my asset on TradingView mean my account is connected?
No. A chart symbol identifies a market-data series, not an authenticated trading account. Verify account connectivity separately in Trading Panel.
Can I use TradingView charts without connecting a broker?
Yes, chart analysis and broker connectivity are separate functions. Check the selected instrument's data source and data status before treating the chart as a reference for live execution.
Why are the prices different on my chart and trading screen?
Different instruments, venues, quote currencies, sessions, or price fields can produce different displayed prices. Match those details and compare timestamps before treating the difference as a technical fault.
Can a TradingView alert place a trade automatically?
An ordinary alert notification does not place a trade. Automated execution requires a separately supported and configured execution workflow, including authentication and order handling.
Should I create an API key to connect my charts?
Create an API key only when the documented connection workflow requires it. Do not paste secrets into chart scripts, shared layouts, or unverified connector forms.
Can U.S. persons use Roxom for this workflow?
No. Roxom excludes U.S. persons. Confirm eligibility before attempting account setup or authentication.
One last thing
A perfectly matching chart still does not prove that an order was submitted. Before relying on the setup, identify the account screen that confirms order acceptance and execution. That single distinction prevents chart activity from being mistaken for trading activity.